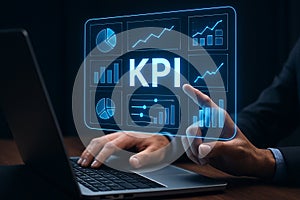
kpi dashboard analytics data charts graphs business performance indicators metrics analysis reporting strategy goals |
||||||||||||||||||||||||||||||||||||||||
navigate by keyword : kpi dashboard analytics data charts graphs business performance indicators metrics analysis reporting strategy goals management finance investment growth success technology digital marketing sales team project planning review monitor evaluate measure results insights trends forecast prediction innovation solution development research progress achievement target vision mission values leadership teamwork collaboration communication |
||||||||||||||||||||||||||||||||||||||||
|
||||||||||||||||||||||||||||||||||||||||
KPI dashboard displays business performance indicators using charts graphs and data analytics to monitor metrics and track progress towards strategic goals. This digital interface provides insights i |
||||||||||||||||||||||||||||||||||||||||
Stockphotos.ro (c) 2025. All stock photos are provided by Dreamstime and are copyrighted by their respective owners. |