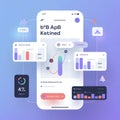
isometric data dashboard displaying charts graphs and colorful business analytics for information visualization strategy |
||||||||||||||||||||||||||||||||||||||||
navigate by keyword : data visualization dashboard charts graphs analytics business intelligence information display isometric design strategy monitoring reporting performance key indicators metrics analysis datadriven progress presentation statistical management graphic abstract graphical representation report screen technology infographics diagram modern flat colorful monitor |
||||||||||||||||||||||||||||||||||||||||
|
||||||||||||||||||||||||||||||||||||||||
Isometric Data Dashboard Displaying Charts, Graphs and Colorful Business Analytics for Information Visualization and Strategy Development AI generated |
||||||||||||||||||||||||||||||||||||||||
Stockphotos.ro (c) 2025. All stock photos are provided by Dreamstime and are copyrighted by their respective owners. |