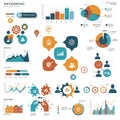
infographic with various data visualizations including bar charts line graphs and pie |
||||||||||||||||||||||||||||||||||||||||
navigate by keyword : visualizations values trends text statistical showcasing shades sets screenshot scattered red radial purposes providing presentation poster pie percentages pattern organized orange numerical number multimedia lines line layout labeled intersecting information infographic including illustrate icons graphs graphical games gadget font flow features elements diverse display diagram detailed designed design data dark complex circular circle charts chart cartoon brand blue bar background axes art analytical aigenerated advertising |
||||||||||||||||||||||||||||||||||||||||
|
||||||||||||||||||||||||||||||||||||||||
Infographic with various data visualizations including bar charts, line graphs, and pie charts in shades of blue, orange, and red against a dark background. It features a radial chart and flow diagram with intersecting lines. The layout is detailed, showcasing statistical information, percentages, and labeled axes. Circular icons with graphical elements and numerical values are scattered throughout, providing an organized display of complex data. Designed to illustrate diverse data sets and trends for analytical purposes. |
||||||||||||||||||||||||||||||||||||||||
Stockphotos.ro (c) 2025. All stock photos are provided by Dreamstime and are copyrighted by their respective owners. |