infographic featuring various data visualization elements including line graph

navigate by keyword : visualization visual timeline text suitable structure statistical sections screenshot presenting presentation points plan placeholders parts palette orange numerical multimedia modern map lorem logo lines line like layout labeled ipsum information infographic including icons gray graph font flow featuring enhancing elements drawing document diagram design data dashed connect communication color clean circular circle chart cartoon

Infographic featuring various data visualization elements, including a line graph, Royalty Free Stock Photo
A collection of business infographic elements, including charts, icons, and graphs, designed for professional presentations. Royalty Free Stock Photo
AI-Generated Data Dashboard Royalty Free Stock Photo
Modern Infographics Template with Timeline and Charts Royalty Free Stock Photo


Infographic featuring various data visualization elements, including a line graph,


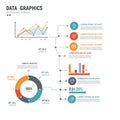
Infographic featuring various data visualization elements, including a line graph, circular chart, bar graph, and timeline. The design uses a color palette of blue, orange, and gray. Sections are labeled with placeholders like "Lorem Ipsum" and numerical data points such as "03," "20%," and "00%." Dashed lines connect different parts of the infographic, adding structure and flow. Icons accompany text blocks, enhancing visual communication. The overall layout is clean and modern, suitable for presenting statistical information.


Stockphotos.ro (c) 2025. All stock photos are provided by Dreamstime and are copyrighted by their respective owners.