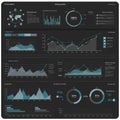
infographic features various charts and graphs dark background includes bar |
||||||||||||||||||||||||||||||||||||||||
| navigate by keyword : world visual values upward trends text technology symbolize statistics segments sections screenshot representation reach presentation poster placeholders pie percentages offer numerical number multimedia marked map logo line like infographic indicates includes illustrating icons highlight growth graphs global generated games gadget font features document diagram design data dark context comprehensive comparisons communication colorful circular circle charts categories cartoon bar background |
||||||||||||||||||||||||||||||||||||||||
|
||||||||||||||||||||||||||||||||||||||||
| Infographic features various charts and graphs on a dark background. Includes bar charts, pie charts, and line graphs with colorful segments, illustrating data comparisons and growth trends. Circular icons symbolize categories like communication and technology. A world map at the bottom indicates global reach. Data sections marked with percentages and numerical values highlight statistics. Arrowed graphs suggest upward trends, and text placeholders offer additional context. Overall, a comprehensive visual representation of global data analytics. |
||||||||||||||||||||||||||||||||||||||||
|
Stockphotos.ro (c) 2025. All stock photos are provided by Dreamstime and are copyrighted by their respective owners. |
||||||||||||||||||||||||||||||||||||||||