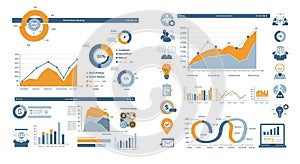
infographic features multiple data visualizations including line graphs pie charts and

navigate by keyword : visualizations value typography trends tones text symbols suitable structured social screenshot reports presentations presentation plan pie performance orange multiple multimedia metrics media marketing logo line like light learning layout insights infographic influence including icons gray graphs globes generated font flowchart features emphasizing elements easy drawing document display digital diagrams diagram design depict datadriven data customer comparison clarity circular charts cartoon business bulbs brand blue bar analytics

Infographic features multiple data visualizations including line graphs, pie charts, and Royalty Free Stock Photo
Infographic with multiple charts and graphs on a dark background. Features diverse Royalty Free Stock Photo
Tech-themed infographic with a dark blue and teal color scheme. Features multiple Royalty Free Stock Photo


Infographic features multiple data visualizations including line graphs, pie charts, and


Infographic features multiple data visualizations including line graphs, pie charts, and bar graphs, primarily in orange, blue, and gray tones. Typography and icons, such as globes, light bulbs, and social media symbols, accompany the graphs. The charts display metrics like customer acquisition, value, and social influence. Circular diagrams and flowchart elements depict trends and analytics, emphasizing data-driven insights. The layout is structured for clarity and easy comparison, suitable for presentations or reports on business performance and digital marketing analytics.


Stockphotos.ro (c) 2025. All stock photos are provided by Dreamstime and are copyrighted by their respective owners.