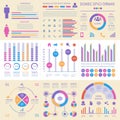
infographic dashboard interface information panel with finance graphs pie chart and comparison diagrams |
||||||||||||||||||||||||||||||||||||||||
navigate by keyword : abstract activity analysis analytics analyzing application background bar chart column concept dashboard data design diagram display element finance financial flat gradient graph graphic growth hud illustration infographic information interface label map mockup modern network page pie report set simple statistic statistics technology template trend vector visualization web website workflow |
||||||||||||||||||||||||||||||||||||||||
|
||||||||||||||||||||||||||||||||||||||||
Infographic dashboard. Ui interface, information panel with finance graphs, pie chart and comparison diagrams. Minimalistic infographic template with flat design daily statistics graphs. Vector |
||||||||||||||||||||||||||||||||||||||||
Stockphotos.ro (c) 2025. All stock photos are provided by Dreamstime and are copyrighted by their respective owners. |