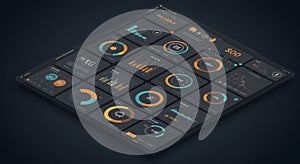
illustration digital dashboard interface displaying multiple data visualization |
||||||||||||||||||||||||||||||||||||||||
| navigate by keyword : visualizations visualization visibility vibrant values text techoriented teal suggesting screenshot scheme progress presenting presentation pie performance percentages pattern organized organ orange number multiple multimedia modern metrics meters line lighting light layout interface information indicators include grid gray graphs generated games gadget font features enhances elements electronics displaying digital diagram design data dashboard dark currency color circular circle charts brand bar background |
||||||||||||||||||||||||||||||||||||||||
|
||||||||||||||||||||||||||||||||||||||||
| A 3D illustration of a digital dashboard interface displaying multiple data visualization elements. The interface features various graphs, charts, and meters in a color scheme of orange, teal, and gray. These include bar charts, pie charts, line graphs, and circular progress indicators. The layout is organized in a grid pattern, presenting information such as percentages, currency values, and performance metrics. A dark background enhances the visibility of the vibrant data visualizations, suggesting a modern, tech-oriented design. |
||||||||||||||||||||||||||||||||||||||||
|
Stockphotos.ro (c) 2025. All stock photos are provided by Dreamstime and are copyrighted by their respective owners. |
||||||||||||||||||||||||||||||||||||||||