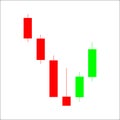
hammer candlestick chart pattern candle stick graph trading analyze the trade foreign exchange and stock market

navigate by keyword : analysis bar broker business candle candles candlestick change chart close currency data diagram exchange finance forex graph growth hammer history icon illustration index investment japanese line loss market model money open price profit prognosis regularity report research risk scheme stock strategy success tail technical trade trading trend wall

Hammer candlestick chart pattern. Candle stick graph trading chart to analyze the trade in the foreign exchange and stock market. Royalty Free Stock Photo
Inverted hammer candlestick chart pattern. Candle stick graph tr Royalty Free Stock Photo
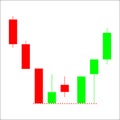
Inverted hammer, fortress, Doji and bullish engulfing candlestick chart pattern. Set of candle stick. Candle stick graph trading Royalty Free Stock Photo
Hammer candlestick chart pattern. Set of candle stick. Candle st Royalty Free Stock Photo
Inverted Hammer candlestick chart pattern. Set of candle stick. Royalty Free Stock Photo
   
   
Hammer candlestick chart pattern. Candle stick graph trading chart to analyze the trade in the foreign exchange and stock market.
Inverted Black Hammer candlestick chart pattern. Set of candle s Royalty Free Stock Photo


Candle stick graph trading chart to analyze the trade in the foreign exchange and stock market, icon - stock


Stockphotos.ro (c) 2025. All stock photos are provided by Dreamstime and are copyrighted by their respective owners.