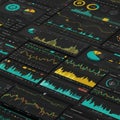
graphical representation financial data features multiple line and bar charts with |
||||||||||||||||||||||||||||||||||||||||
navigate by keyword : volume volatility values use trends time text suggesting stage signage show sets screenshot representation red provide presentation performance patterns number night neon multiple multimedia metrics market lines line lighting light indicating histograms highlights graphs graphical gadget font fluctuating financial features dynamic displays data darkness dark comparative colors circular charts chart candlestick brand blue bar background analysis aigenerated advertising additional |
||||||||||||||||||||||||||||||||||||||||
|
||||||||||||||||||||||||||||||||||||||||
Graphical representation of financial data features multiple line and bar charts with candlestick patterns, indicating stock market trends. The chart displays fluctuating data lines in red and blue against a dark background, suggesting dynamic changes in stock values over time. Additional circular graphs show comparative data, and histograms below provide volume data. The use of colors such as red and blue highlights different data sets and trends, indicating volatility and analysis of financial performance metrics. |
||||||||||||||||||||||||||||||||||||||||
Stockphotos.ro (c) 2025. All stock photos are provided by Dreamstime and are copyrighted by their respective owners. |