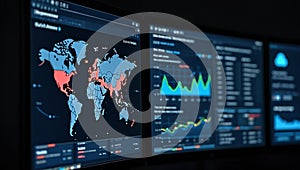
global digital network activity monitoring and data analysis dashboard

navigate by keyword : world used text television tables signage setup screenshot screens screen right regions red readability presentation person numerical network multiple multimedia monitors monitoring metrics map management line likely left indicating highlighted graphs global generative games gadget font features environments electronics easy display digital design data dashboard dark cybersecurity computer charts brand blue background analysis advertising activity

Global Digital Network Activity Monitoring and Data Analysis Dashboard Royalty Free Stock Photo
Global Network Data Visualization and Analysis Dashboard Royalty Free Stock Photo
Global Network Monitoring System  Data Visualization  World Map  Digital Dashboard Royalty Free Stock Photo
Global Data Visualization System Showing Worldwide Network Activity Royalty Free Stock Photo
World map big data visualization. Hotspots on map. Global activity monitoring. Complex visual geo information. Human activity data Royalty Free Stock Photo
Blockchain network with interconnected cubes, data dashboard, and global map representation Royalty Free Stock Photo
Futuristic cybersecurity control room monitoring global network activity Royalty Free Stock Photo
Global Digital Network Activity Monitoring and Data Analysis Dashboard
Global cybersecurity dashboard monitoring network threats and data intrusion worldwide Royalty Free Stock Photo
Control center monitoring global network activity on world map Royalty Free Stock Photo
Operator Monitoring Data in a High-Tech Control Room. Royalty Free Stock Photo
Control center monitoring global network activity with world map displaying data points Royalty Free Stock Photo
Multiple computer monitors display a digital network activity monitoring and data analysis dashboard. The left screen features a world map with regions highlighted in red and blue, possibly indicating different data metrics. The right screens display various graphs, charts, and tables with line graphs and numerical data, all against a dark background for easy readability. The setup is likely used for global digital monitoring, possibly in cybersecurity or network management environments. ai generative


Stockphotos.ro (c) 2025. All stock photos are provided by Dreamstime and are copyrighted by their respective owners.