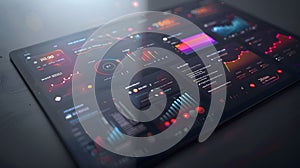
futuristic interface with graphs and charts the screen rendering

navigate by keyword : bar blue brand car charts circular colorful combination dark data depth design digital displays distinct electronics elements environment features font futuristic gadget games generated give glossy graphs hightech hues indicators information interactive interactivity interface layout light line machine monitoring multimedia orange organized perspective readouts red rendering screen screenshot sections sense shading signage sleek technology text used vehicle vibrant visualization

Futuristic interface with graphs and charts on the screen, 3d rendering Royalty Free Stock Photo
Futuristic user interface with graphs and charts, 3d rendering Generated with AI Royalty Free Stock Photo
Futuristic user interface with charts and graphs. 3d rendering Royalty Free Stock Photo
High-tech data interface with graphs, charts, and futuristic visuals. Perfect for technology, business, finance, and analytics- Royalty Free Stock Photo
Futuristic interface with financial charts and graphs, 3d rendering Royalty Free Stock Photo
Digital tablet screen with business charts and graphs on the screen. 3d rendering Royalty Free Stock Photo
user interface with charts and graphs. 3d rendering Royalty Free Stock Photo
Futuristic interface with graphs and charts on the screen, 3d rendering
Futuristic glowing screen with financial charts and graphs, 3d rendering Royalty Free Stock Photo
Financial data interface displaying graphs, bar charts, and circular diagrams on a futuristic digital background. 3D Rendering Royalty Free Stock Photo
user interface with charts and graphs. 3d rendering Royalty Free Stock Photo
Futuristic financial data interface with charts and graphs on a smart device, glowing neon design. 3D Rendering Royalty Free Stock Photo
smart home control interface on laptop screen Royalty Free Stock Photo
A sleek, futuristic interface displays an array of colorful graphs and charts on a glossy, dark screen. The 3D rendering features a combination of bar charts, line graphs, and circular indicators in vibrant hues of red, orange, and blue. Information is organized into distinct sections, each with digital readouts and interactive elements. The layout and design suggest advanced data visualization technology, potentially used for analytics or monitoring in a high-tech environment. The perspective and shading give a sense of depth and interactivity. Generated with AI


Stockphotos.ro (c) 2025. All stock photos are provided by Dreamstime and are copyrighted by their respective owners.