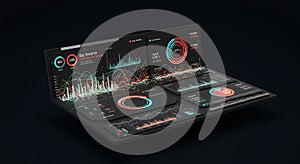
futuristic data visualization interactive dashboard with neon charts and graphs |
||||||||||||||||||||||||||||||||||||||||
navigate by keyword : web visualization vibrant trends technology technological system statistics software showcases sense screen science scene rendering progress performance network neon modern metrics market kpis kpi key internet interface interactive innovative innovation information indicators growth graphs graphic futuristic future finance evokes dynamic displaying display digital design data dashboard dark concept computer colors colorful charts business background application analytics analysis advancement abstract |
||||||||||||||||||||||||||||||||||||||||
|
||||||||||||||||||||||||||||||||||||||||
A 3D rendering showcases a futuristic data dashboard displaying dynamic charts, graphs, and key performance indicators (KPIs) in vibrant neon colors against a dark background. The scene evokes a sense of technological advancement and data analysis |
||||||||||||||||||||||||||||||||||||||||
Stockphotos.ro (c) 2025. All stock photos are provided by Dreamstime and are copyrighted by their respective owners. |