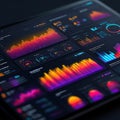
futuristic data dashboard displaying various charts and graphs digital format |
||||||||||||||||||||||||||||||||||||||||
navigate by keyword : visualization visual used threedimensional text suggests style stage signage sets screenshot scheme resembling red poster points pie percentages organized orange multimedia machine line layout labels labeled interpreting interface include illuminated hightech graphs games gadget futuristic format font finance elements displaying digital designs design data dashboard dark complex comics color charts brand blue bar background art analytics aigenerated advertising |
||||||||||||||||||||||||||||||||||||||||
|
||||||||||||||||||||||||||||||||||||||||
A futuristic data dashboard displaying various charts and graphs in a digital format. Elements include pie charts, bar graphs, and line graphs with a color scheme of blue, orange, and red. The designs are illuminated against a dark background, resembling a high-tech interface. Charts are labeled with data points, percentages, and labels, organized in a three-dimensional layout. The visual style suggests advanced data visualization, often used in finance or analytics for interpreting complex data sets. |
||||||||||||||||||||||||||||||||||||||||
Stockphotos.ro (c) 2025. All stock photos are provided by Dreamstime and are copyrighted by their respective owners. |