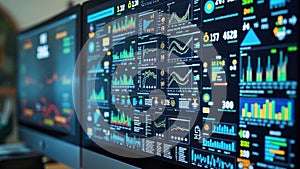
dynamic data analysis multiple monitors displaying real time graphs and charts |
||||||||||||||||||||||||||||||||||||||||
navigate by keyword : graphs information metrics numbers trends insights dashboard digital computation communication economy performance charts research analysis technology reports details visualization indicators statistics interface finance software management computing monitoring tools overview interactive presentation monitors analytics screen business data tracking display desktop strategy |
||||||||||||||||||||||||||||||||||||||||
|
||||||||||||||||||||||||||||||||||||||||
Dynamic data analysis on multiple monitors displaying real-time graphs and charts. That the image is generated using AI. |
||||||||||||||||||||||||||||||||||||||||
Stockphotos.ro (c) 2025. All stock photos are provided by Dreamstime and are copyrighted by their respective owners. |