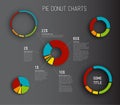
donut pie chart with colorful infographics and data visualization |
||||||||||||||||||||||||||||||||||||||||
navigate by keyword : abstract advertising analytics annual artificial artwork bar brand business cartoon chart charting circle clean colorful concept corporate creative dashboard data design diagram digital donut economic economy elements finance font futuristic gadget generated graph icon infochart infographic infographics information intelligence label layout line logo marketing metric modern multimedia organ percentage pie poster presentation report screenshot set software statistics technology template text toy visual visualization web wheel |
||||||||||||||||||||||||||||||||||||||||
|
||||||||||||||||||||||||||||||||||||||||
A 3D-rendered donut pie chart surrounded by bar graphs and data visualization elements on a white background. This AI-generated image is ideal for use in presentations, business reports, data analysis, or infographic designs. Created using generative AI tools. |
||||||||||||||||||||||||||||||||||||||||
Stockphotos.ro (c) 2025. All stock photos are provided by Dreamstime and are copyrighted by their respective owners. |