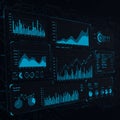
displaying multiple data visualizations including line graphs bar charts and pie |
||||||||||||||||||||||||||||||||||||||||
navigate by keyword : visualizations trends track text technology suggests stage signage screenshot red quantitative purple provide proportions poster pie number nightclub night neon multiple line light interpretation interface insights including illustrate hues highlight graphs font focus fluctuations finance emphasizing displaying disco digital data dark comparisons circular charts bright brand blue bar background analysis aigenerated advertising |
||||||||||||||||||||||||||||||||||||||||
|
||||||||||||||||||||||||||||||||||||||||
Displaying multiple data visualizations, including line graphs, bar charts, and pie charts against a dark background. Bright red and blue hues highlight trends and comparisons. Circular pie charts illustrate proportions, while line graphs track fluctuations. The bar charts provide quantitative insights. The digital interface suggests a focus on technology or finance, emphasizing data analysis and interpretation. |
||||||||||||||||||||||||||||||||||||||||
Stockphotos.ro (c) 2025. All stock photos are provided by Dreamstime and are copyrighted by their respective owners. |