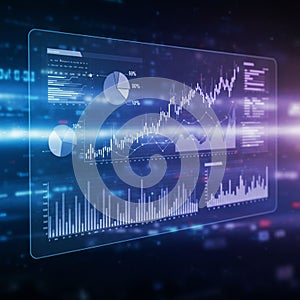
digital interface with data visualizations including line graphs bar charts and pie |
||||||||||||||||||||||||||||||||||||||||
navigate by keyword : visualizations varying values use trends transparent text technology statistics stage signage show sense screenshot screen purple progressive presentation predominant pie performance percentages multimedia metrics lines line lighting light interface indicating including hues hightech graphs gadget futuristic font financial features faint enhancing electronics effect dots displays digital data creates charts brand bokeh blue bar background appearance aigenerated advertising advanced |
||||||||||||||||||||||||||||||||||||||||
|
||||||||||||||||||||||||||||||||||||||||
Digital interface with data visualizations, including line graphs, bar charts, and pie charts. Displays progressive data trends and statistics on a transparent screen. Predominant use of blue and purple hues creates a futuristic and high-tech appearance. The charts show varying percentages and values, indicating performance metrics or financial trends. The background features a bokeh effect with faint digital lines and dots, enhancing the sense of advanced technology. |
||||||||||||||||||||||||||||||||||||||||
Stockphotos.ro (c) 2025. All stock photos are provided by Dreamstime and are copyrighted by their respective owners. |