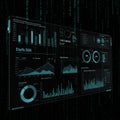
digital futuristic dashboard display with various graphs charts and numerical data |
||||||||||||||||||||||||||||||||||||||||
| navigate by keyword : visual violet titled text symbolizing surrounding streams signage shows shades screenshot screen scheme purple progress presentation poster points pink pie numerical number logo lines line light innovative indicators hightech graphs glowing futuristic font flow features elements effect display digital design data dashboard dasbrard creating connectivity color circular circle charts brand bar aigenerated advertising |
||||||||||||||||||||||||||||||||||||||||
|
||||||||||||||||||||||||||||||||||||||||
| A digital, futuristic dashboard display with various graphs, charts, and numerical data, titled "Dasbrard." The screen shows elements such as pie charts, bar graphs, and circular progress indicators. Surrounding the display are streams of glowing pink data points and lines, symbolizing data flow or connectivity. The overall color scheme features shades of purple and pink, creating a high-tech and innovative visual effect. |
||||||||||||||||||||||||||||||||||||||||
|
Stockphotos.ro (c) 2025. All stock photos are provided by Dreamstime and are copyrighted by their respective owners. |
||||||||||||||||||||||||||||||||||||||||