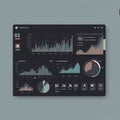
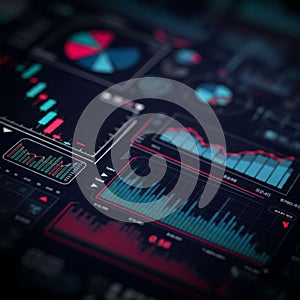
digital display various data visualizations featuring colorful bar charts line |
||||||||||||||||||||||||||||||||||||||||
navigate by keyword : visualizations used use typically trends tracking text technology teal suggests statistics stage signage sectors screenshot reporting red purple pie performance organized number music multimedia metrics may line light layout interpretation insights information indicators include highlights graphs gadget font financial finance featuring emphasis elements electronics display digital detailed design data dashboards darkness dark colors colorful charts brand blue black bar background analytical analysis aigenerated |
||||||||||||||||||||||||||||||||||||||||
|
||||||||||||||||||||||||||||||||||||||||
A digital display of various data visualizations, featuring colorful bar charts, line graphs, and pie charts. These elements are organized against a dark background, typically used in technology or finance sectors for data analysis, dashboards, or reporting. The use of red and teal colors highlights different data trends and metrics, which may include financial statistics, performance indicators, or other analytical insights. The overall layout suggests an emphasis on detailed information tracking and interpretation. |
||||||||||||||||||||||||||||||||||||||||
Stockphotos.ro (c) 2025. All stock photos are provided by Dreamstime and are copyrighted by their respective owners. |