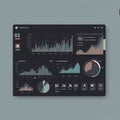
digital display featuring various financial analytics includes bar graphs line charts |
||||||||||||||||||||||||||||||||||||||||
navigate by keyword : world white visualizations time text statistical signage sign set represent poster pie photograph office number monochrome modern metrics map line like label includes grayscale graphs geographic font focus financial featuring enhancing distribution display digital design data charts chart brand blurred blue black bar banner background art analytics analysis aigenerated advertising |
||||||||||||||||||||||||||||||||||||||||
|
||||||||||||||||||||||||||||||||||||||||
Digital display featuring various financial analytics. Includes bar graphs, line charts, pie chart, and a world map, all in grayscale. The charts represent different metrics like financial data over time, statistical analysis, and geographic distribution. The display is set in a modern office with a blurred background, enhancing focus on the data visualizations. |
||||||||||||||||||||||||||||||||||||||||
Stockphotos.ro (c) 2025. All stock photos are provided by Dreamstime and are copyrighted by their respective owners. |