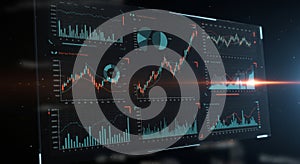
digital display featuring multiple data analytics visualizations includes bar graphs |
||||||||||||||||||||||||||||||||||||||||
navigate by keyword : visualizations varying used trends tools tones text suggests statistical stage signage screenshot representing red points pie performance number night neon multiple multimedia line likely lighting light lens interpretation interface information includes impression hightech graphs generated gadget futuristic font fluctuations flare financial featuring effect dynamic display digital depth decisionmaking data darkness dark charts brand blue bar background arrangement analytics analytical advertising adding |
||||||||||||||||||||||||||||||||||||||||
|
||||||||||||||||||||||||||||||||||||||||
Digital display featuring multiple data analytics visualizations. Includes bar graphs, line charts, and pie charts with varying data points in blue and red tones against a dark background. Graphs display trends and fluctuations, likely representing financial or statistical information. The image gives an impression of a futuristic or high-tech interface, with a lens flare effect adding depth and dynamic lighting. The arrangement suggests analytical tools used for data interpretation and decision-making. |
||||||||||||||||||||||||||||||||||||||||
Stockphotos.ro (c) 2025. All stock photos are provided by Dreamstime and are copyrighted by their respective owners. |