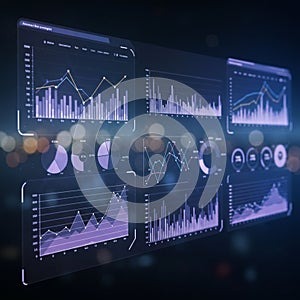
digital data visualization screen displaying multiple charts and graphs features |
||||||||||||||||||||||||||||||||||||||||
navigate by keyword : visualization used types trends technologydriven suggests stage signage shades screenshot screen purple presents presentation points pie performance numerical nightclub night music multiple line light labels including highlighting graphs graph futuristic font features effect displaying disco digitalaigenerated digital design decisionmaking data dashboard dark concert comprehensive charts brand bokeh blue bar background axes arrangement analysis aigenerated advertising |
||||||||||||||||||||||||||||||||||||||||
|
||||||||||||||||||||||||||||||||||||||||
Digital data visualization screen displaying multiple charts and graphs. Features various types of charts, including line graphs, bar graphs, and pie charts in shades of blue and purple. Each graph presents data points and trends, with numerical axes and labels. The background is dark with a bokeh effect, highlighting the futuristic and technology-driven design. The arrangement suggests a comprehensive dashboard used for data analysis and decision-making. |
||||||||||||||||||||||||||||||||||||||||
Stockphotos.ro (c) 2025. All stock photos are provided by Dreamstime and are copyrighted by their respective owners. |