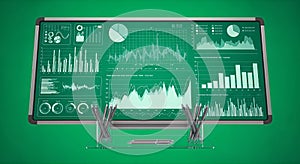
digital data analytics dashboard with charts and graphs for business intelligence

navigate by keyword : aigenerated data analytics digital dashboard business intelligence visualization graphs charts performance monitoring software analysis financial metrics analytical reporting bar line pie trends statistical corporate big science insights market economic forecasting driven decisions kpi interface management visual charting tools display report real time chart infographics interpretation innovative information

Digital Data Analytics Dashboard with Charts and Graphs for Business Intelligence Royalty Free Stock Photo
Digital Data Analytics Dashboard with Graphs and Charts for Business Intelligence Royalty Free Stock Photo
Digital dashboard with colorful graphs and charts displaying real-time data analytics, representing advanced business intelligence Royalty Free Stock Photo
Data Analytics Dashboard Business Intelligence, Charts, Graphs Royalty Free Stock Photo
financial analytics, dashboard with finance charts and data graphs, business intelligence Royalty Free Stock Photo
Digital Data Analytics Dashboard with Charts and Graphs for Business Intelligence
Digital dashboard with colorful graphs and charts displaying real-time data analytics, representing advanced business intelligence Royalty Free Stock Photo
Futuristic Data Analytics Dashboard Interface with Holographic Charts and Graphs for Business Intelligence and Technology Royalty Free Stock Photo
Futuristic Digital Data Analytics Dashboard with Charts and Graphs Royalty Free Stock Photo
Data visualization dashboard charts graphs analytics business intelligence screen tech ui. Stock Photo, Generative AI Royalty Free Stock Photo
Data analysis dashboard business intelligence analytics financial technology charts graphs statistics information system Royalty Free Stock Photo
Analyzing data analytics dashboard business intelligence charts graphs information technology management system Royalty Free Stock Photo
Futuristic Data Analytics Dashboard Interface with Holographic Charts and Graphs for Business Intelligence and Technology Royalty Free Stock Photo
A high-tech digital data analytics dashboard displaying various charts and graphs, used for business intelligence, data analysis, and performance monitoring. Ideal for reports, presentations, or data-driven decision making in corporate environments.


Stockphotos.ro (c) 2025. All stock photos are provided by Dreamstime and are copyrighted by their respective owners.