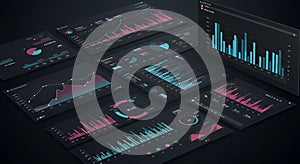
digital dashboards displaying various data visualizations including bar graphs line |
||||||||||||||||||||||||||||||||||||||||
navigate by keyword : visualizations visibility values use trend tracking text stage signage shades screenshot screen scheme represent purple present pink pie performance percentages numerical number multiscreen multimedia modern lines line likely like interface intended insights indicators including hightech graphs games gadget format font features enhances electronics displaying digital designed design datasets data dashboards contrasting colors color charts business brand blue black bar arranged appears analytics analysis aigenerated advertising |
||||||||||||||||||||||||||||||||||||||||
|
||||||||||||||||||||||||||||||||||||||||
Digital dashboards displaying various data visualizations, including bar graphs, line charts, and pie charts, are arranged in a multi-screen format. The color scheme primarily features shades of blue, pink, and black. Each screen appears to present different datasets with indicators like percentages, numerical values, and trend lines. Designed for data analysis, these dashboards represent a modern, high-tech interface, likely intended for business analytics or performance tracking. The use of contrasting colors enhances the visibility of data insights. |
||||||||||||||||||||||||||||||||||||||||
Stockphotos.ro (c) 2025. All stock photos are provided by Dreamstime and are copyrighted by their respective owners. |