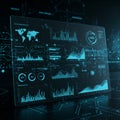
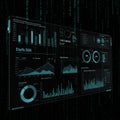
digital dashboard interface with various graphs charts and data visualizations |
||||||||||||||||||||||||||||||||||||||||
navigate by keyword : visualizations virtual theme text suggesting signage shades screenshot realtime processing presentation poster pie percentages patterns numerical numbers number multimedia monitoring logo line light layout interface information include implies hightech highlighted green graphs gadget futuristic font focus features enhanced effect displays digital design data dashboard darkness dark cyberspace contributing circle charts brand blurred blue bar background |
||||||||||||||||||||||||||||||||||||||||
|
||||||||||||||||||||||||||||||||||||||||
Digital dashboard interface with various graphs, charts, and data visualizations. Features include bar graphs, pie charts, and numerical displays. The interface has a high-tech, futuristic design, primarily in shades of blue and green. Numbers and percentages are highlighted, suggesting data analytics or monitoring. The background has a dark, blurred effect enhanced with green digital patterns, contributing to a virtual or cyberspace theme. The overall layout implies a focus on data analysis and real-time information processing. |
||||||||||||||||||||||||||||||||||||||||
Stockphotos.ro (c) 2025. All stock photos are provided by Dreamstime and are copyrighted by their respective owners. |