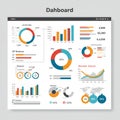
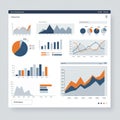
digital dashboard interface displaying various data visualizations including bar |
||||||||||||||||||||||||||||||||||||||||
| navigate by keyword : work window website web visualizations use top themes text systematically symbols suitable solar screenshot scheme revenue renewable remote question purposes professional presentation present points plan pie percentage panel organized orange multimedia metrics logo line learning layout labels interface indicated including header gray graphs generatedillustration gadget font focus financial figures featuring energy emulates document displaying digital diagram design |
||||||||||||||||||||||||||||||||||||||||
|
||||||||||||||||||||||||||||||||||||||||
| A digital dashboard interface displaying various data visualizations, including bar graphs, pie charts, and line graphs. The charts use a color scheme of orange, blue, and gray. Labels such as "Revenue" and "Customer Question" suggest a focus on financial and customer metrics. The layout is organized to present different data points systematically, with figures and percentage symbols. The dashboard emulates a web browser window, indicated by a browser-like header. The overall design is clean and professional, suitable for analytical purposes. |
||||||||||||||||||||||||||||||||||||||||
|
Stockphotos.ro (c) 2025. All stock photos are provided by Dreamstime and are copyrighted by their respective owners. |
||||||||||||||||||||||||||||||||||||||||