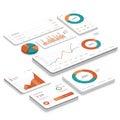
digital dashboard interface displaying various charts and graphs primarily |
||||||||||||||||||||||||||||||||||||||||
| navigate by keyword : widgets upper tool text suggests skeninsmy shades sets separating sel sections rots representing pie ourent organized numerical monitoring modern metrics lower line like layout labeled interface information includes headings green graphs financial displaying digital design datacentric data dashboard charts categories business blue bar artificial analytic aigenerated aiaigeneratedgenerated |
||||||||||||||||||||||||||||||||||||||||
|
||||||||||||||||||||||||||||||||||||||||
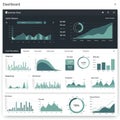
| A digital dashboard interface displaying various charts and graphs, primarily in shades of blue and green. It includes line graphs, bar charts, pie charts, and numerical widgets labeled with artificial text. Sections have headings like "Ourent," "Sel Rots," and "Skeninsmy," representing different data categories. The layout is organized, with upper and lower sections separating different information sets. The overall design suggests a modern, data-centric, analytic tool for monitoring financial or business metrics. |
||||||||||||||||||||||||||||||||||||||||
|
Stockphotos.ro (c) 2025. All stock photos are provided by Dreamstime and are copyrighted by their respective owners. |
||||||||||||||||||||||||||||||||||||||||