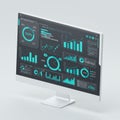
digital dashboard displays various data visualizations screen features |
||||||||||||||||||||||||||||||||||||||||
navigate by keyword : visualizations visual trends tones surrounded suggests software smaller signage sign showing screen points pie performance percentages organized numerical multimedia metrics marked main machine line lighting light layout large interface intelligence information green graphs graph glance generated gadget font features electronics easy displays digital design data dashboard cues clear charts business black bar assessment analysis advertising |
||||||||||||||||||||||||||||||||||||||||
|
||||||||||||||||||||||||||||||||||||||||
A digital dashboard displays various data visualizations on a screen. It features graphs, pie charts, and bar charts primarily in green and black tones. The main graph is a large green line graph with data points marked, surrounded by smaller charts and metrics showing percentages and numerical data. The interface suggests data analysis or business intelligence software, with clear visual cues for performance metrics and data trends. The layout is organized for easy information assessment at a glance. |
||||||||||||||||||||||||||||||||||||||||
Stockphotos.ro (c) 2025. All stock photos are provided by Dreamstime and are copyrighted by their respective owners. |