digital dashboard displays various analytics and data visualizations |
||||||||||||||||||||||||||||||||||||||||
navigate by keyword : workplace white wall visualizations visual transparent time text techsavvy technology suggesting statistics signage sign setting sections screen sales readability processes presentation poster pie performance percentages organized office numerical modern metrics line like lighting include illustrating graphs generated font figures featuring environment enhancing elements easy document distributions displays digital design decisionmaking data dashboard context charts business brand blurred blue bar banner background art analytics advertising |
||||||||||||||||||||||||||||||||||||||||
|
||||||||||||||||||||||||||||||||||||||||
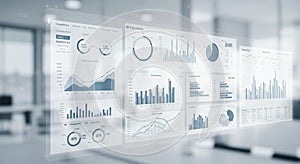
A digital dashboard displays various analytics and data visualizations on a transparent screen. Graphs include line, bar, and pie charts, illustrating metrics like distributions, sales figures, and performance over time. The setting is a modern office environment with blurred background elements, suggesting a tech-savvy workplace. The data is organized into sections for easy readability, featuring numerical statistics and percentages alongside visual elements, enhancing decision-making processes in a business or technology context. |
||||||||||||||||||||||||||||||||||||||||
Stockphotos.ro (c) 2025. All stock photos are provided by Dreamstime and are copyrighted by their respective owners. |