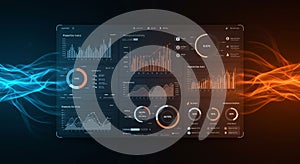
digital dashboard displaying multiple data visualizations including bar graphs line |
||||||||||||||||||||||||||||||||||||||||
navigate by keyword : waves visualizations varied trends text suggesting signage show screenshot right representation progress presentation poster performance percentages orange offering number multiple multimedia motion monitoring metrics line like light left layout interface insights indicators including graphs graphical games gadget frame font focus flow energy electronics dynamic displaying digital diagram design data dashboard dark complex colors circular charts business brand blue bar background analytics aigenerated advertising |
||||||||||||||||||||||||||||||||||||||||
|
||||||||||||||||||||||||||||||||||||||||
Digital dashboard displaying multiple data visualizations, including bar graphs, line charts, and circular progress indicators. Graphs show trends, percentages, and metrics in varied colors like blue and orange against a dark background. Dynamic light waves, blue on the left and orange on the right, frame the interface, suggesting motion or energy flow. The layout is complex, with focus on business analytics or performance monitoring, offering insights through graphical representation. |
||||||||||||||||||||||||||||||||||||||||
Stockphotos.ro (c) 2025. All stock photos are provided by Dreamstime and are copyrighted by their respective owners. |