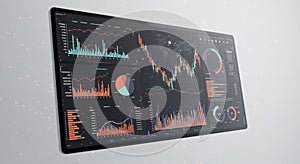
digital dashboard displaying complex array data visualizations and charts the

navigate by keyword : visualizations surrounding suggesting smaller signage sign shades sets separate screenshot screen red presenting poster pie panels organized orange neutral multimedia metrics market machine line layout large information indicates includes gray graphs generated gadget font financial features emphasizing electronics displaying display digital detailing design data dashboard complex colorful clarity circular charts chart center candlestick brand blue bar banner background art array analytics analysis advertising

A digital dashboard displaying a complex array of data visualizations and charts. The Royalty Free Stock Photo
Digital Tablet Displaying Complex Data Visualizations Royalty Free Stock Photo
Complex Data Visualizations on a Dark Computer Screen Royalty Free Stock Photo
Advanced Data Analysis Display Showing Multiple Charts and Graphs Royalty Free Stock Photo
AI-Generated Data Visualization Royalty Free Stock Photo
   
   
A digital dashboard displaying a complex array of data visualizations and charts. The
Man analyzes complex data visualizations on a wall of glowing screens in a modern office Royalty Free Stock Photo
Futuristic Interface with Data Visualization Royalty Free Stock Photo


A digital dashboard displaying a complex array of data visualizations and charts. The screen features bar graphs, line charts, pie charts, and circular graphs, presenting various data analytics. Predominantly in shades of blue, orange, and red, the display includes a large candlestick chart at the center, suggesting financial or stock market analysis. The layout indicates information is organized into separate panels for clarity, with surrounding smaller charts detailing different metrics. The background is a neutral gray, emphasizing the colorful data sets.


Stockphotos.ro (c) 2025. All stock photos are provided by Dreamstime and are copyrighted by their respective owners.