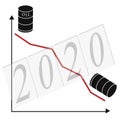
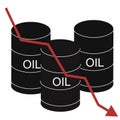
diagram with barrels oil red falling arrow the economic chart financial world crisis and global trade |
||||||||||||||||||||||||||||||||||||||||
navigate by keyword : arrow barrel black business chart commerce concept container cost crisis crude diagram diesel down drop economic economy energy exchange fall finance financial fossil framework fuel gasoline global graph graphic icon illustration industrial industry investment isolated market metal money oil petrol petroleum power price production resource stock trade vector wireframe |
||||||||||||||||||||||||||||||||||||||||
|
||||||||||||||||||||||||||||||||||||||||
Diagram with barrel of oil with red falling arrow of the economic chart. Financial world crisis and global oil trade concept in 2020. Down of oil price, market decline, economy is in shock. Vector. |
||||||||||||||||||||||||||||||||||||||||
Stockphotos.ro (c) 2025. All stock photos are provided by Dreamstime and are copyrighted by their respective owners. |