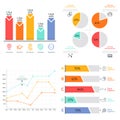
data visualization with bar chart line graph and pie analytics statistics |
||||||||||||||||||||||||||||||||||||||||
| navigate by keyword : data visualization analytics statistics chart graph bar line pie progress growth trend analysis business finance performance report presentation information digital interface screen loading percentage numbers dots connection purple orange green blue render conceptual dashboard metrics research strategy planning success insights |
||||||||||||||||||||||||||||||||||||||||
|
||||||||||||||||||||||||||||||||||||||||
| A 3D render of a purple digital interface displaying various data visualizations. It includes an orange bar chart with green dots connected by a line graph, a circular progress bar with a white segment and a blue outline showing a percentage, and a loading bar. Small orange and green dots are positioned at the top. The background is a muted blue |
||||||||||||||||||||||||||||||||||||||||
|
Stockphotos.ro (c) 2025. All stock photos are provided by Dreamstime and are copyrighted by their respective owners. |
||||||||||||||||||||||||||||||||||||||||