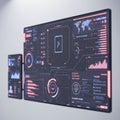
data visualization interface with multiple graphs and charts digital screen |
||||||||||||||||||||||||||||||||||||||||
navigate by keyword : visualization varying used trends text suggests statistics stage sophisticated signage shades screenshot screen quality purple presentation poster pie number multiple luminous line interface intelligence information indicating includes graphs generated futuristic font fluctuating financial enhancing display digital design data dashboard dark circle charts chart business brand blue bar banner background art analytical analysis advertising |
||||||||||||||||||||||||||||||||||||||||
|
||||||||||||||||||||||||||||||||||||||||
Data visualization interface with multiple graphs and charts on a digital screen. Includes line graphs, bar charts, and a pie chart, all in varying shades of blue and purple. The charts display fluctuating data trends and statistics, indicating financial or analytical information. The background is dark, enhancing the luminous quality of the graphs. This sophisticated and futuristic design suggests an information dashboard used for data analysis or business intelligence. |
||||||||||||||||||||||||||||||||||||||||
Stockphotos.ro (c) 2025. All stock photos are provided by Dreamstime and are copyrighted by their respective owners. |