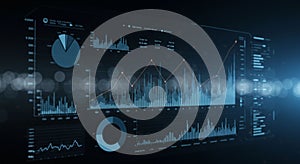
data visualization interface displaying various graphs and charts digital |
||||||||||||||||||||||||||||||||||||||||
navigate by keyword : visuals visualization valleys used trend text statistical stage software small signage sense screenshot prominent presentation poster points pie performance peaks orange numerous night nature modern line lighting light interface indicate include hightech highlights graphs foreground font focus financial feature emphasizing elements effect displaying digital detailed depth data dashboard darkness dark concert charts brand bokeh blue bar background analytical analysis aigenerated |
||||||||||||||||||||||||||||||||||||||||
|
||||||||||||||||||||||||||||||||||||||||
Data visualization interface displaying various graphs and charts on a digital dashboard. Prominent elements include line graphs with peaks and valleys, bar charts, and pie charts. The visuals feature a dark background with blue and orange highlights, often used in financial or analytical software for trend analysis. The bokeh effect in the foreground adds a sense of depth and focus, emphasizing the modern and high-tech nature of the interface. Numerous small line graphs and data points indicate detailed statistical analysis. |
||||||||||||||||||||||||||||||||||||||||
Stockphotos.ro (c) 2025. All stock photos are provided by Dreamstime and are copyrighted by their respective owners. |