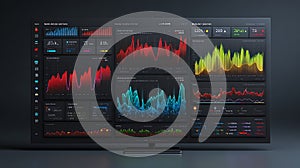
data visualization dashboard with charts and graphs for business intelligence analysis system display |
||||||||||||||||||||||||||||||||||||||||
| navigate by keyword : data visualization dashboard charts graphs business intelligence analysis system display analytics metrics performance monitoring trends insights reporting management strategy planning forecasting optimization efficiency productivity growth success innovation technology digital modern interface screen computer software application platform solution tool design style dark color vibrant complex detailed information abstract futuristic displaying |
||||||||||||||||||||||||||||||||||||||||
|
||||||||||||||||||||||||||||||||||||||||
| A modern data visualization dashboard displaying complex charts and graphs for business intelligence. The ui provides insights into system performance. |
||||||||||||||||||||||||||||||||||||||||
|
Stockphotos.ro (c) 2025. All stock photos are provided by Dreamstime and are copyrighted by their respective owners. |
||||||||||||||||||||||||||||||||||||||||