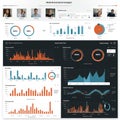
data visualization dashboard displaying graphs and charts for social media strategy |
||||||||||||||||||||||||||||||||||||||||
navigate by keyword : visualization trends top time text strategy specific social signage showing screenshot scheme rates profile presentation poster points placeholder pie performance percentage orange number multimedia middle metrics media logo line key indicators indicating includes highlighting gray graphs generated font follower focuses features engagement drawing document displaying diagram design demographics data dashboard dark counts colorcoded color circular charts categories cartoon brand bottom |
||||||||||||||||||||||||||||||||||||||||
|
||||||||||||||||||||||||||||||||||||||||
Data visualization dashboard displaying graphs and charts for social media strategy analysis. Top section includes bar charts and pie charts indicating follower counts, engagement rates, and demographics. Middle section focuses on different metrics with line and bar graphs, showing trends over time. There are circular percentage indicators for key performance indicators. The bottom section features additional bar graphs and line charts highlighting specific data points with color-coded categories. Includes placeholder profile images and text. Predominantly uses orange, blue, and dark gray color scheme. |
||||||||||||||||||||||||||||||||||||||||
Stockphotos.ro (c) 2025. All stock photos are provided by Dreamstime and are copyrighted by their respective owners. |