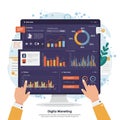
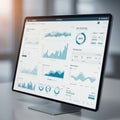
data analytics dashboard computer screen displaying charts and graphs |
||||||||||||||||||||||||||||||||||||||||
navigate by keyword : data analytics dashboard charts graphs computer screen monitor technology information business finance statistics market analysis research growth progress trends insights performance visualization digital metrics numbers reports strategy planning software application interface design modern future innovation development science system network web online intelligence financial user tech graph display interactive report |
||||||||||||||||||||||||||||||||||||||||
|
||||||||||||||||||||||||||||||||||||||||
A clear and modern data analytics dashboard displayed on a computer screen, showcasing various charts, graphs, and performance metrics. The interface emphasizes user-friendly design and data-driven insights, ideal for business presentations, tech projects, analytics reports, or financial visualization. |
||||||||||||||||||||||||||||||||||||||||
Stockphotos.ro (c) 2025. All stock photos are provided by Dreamstime and are copyrighted by their respective owners. |