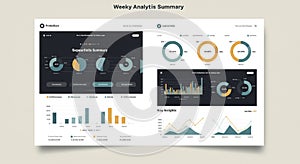
dashboard with data visualizations contains pie charts bar graphs and line |
||||||||||||||||||||||||||||||||||||||||
navigate by keyword : white visualizations trends three text summary statistics showing separatelis screenshot right purposes professional presents presentation poster pie performance percentage orange multimedia monitoring logo line likely left learning layout labeled label key insights includes gray graphs generated gadget font features electronics dominant document distributions displaying diagram design depict data dashboard darkthemed colors circular charts chart categories business brand bottom blue bar background analytics advertising |
||||||||||||||||||||||||||||||||||||||||
|
||||||||||||||||||||||||||||||||||||||||
Dashboard with data visualizations. Contains pie charts, bar graphs, and line graphs, displaying statistics in different categories. Dominant colors are blue, orange, and gray on a white background. The left section features a dark-themed chart labeled "Separatelis Summary" with three circular graphs, while the right includes pie charts showing percentage distributions. Line graphs in the bottom half depict trends under "Key Insights." The layout presents a professional analytics summary, likely for business or performance monitoring purposes. |
||||||||||||||||||||||||||||||||||||||||
Stockphotos.ro (c) 2025. All stock photos are provided by Dreamstime and are copyrighted by their respective owners. |