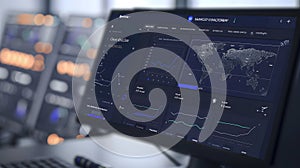
dark blue computer screen displaying data graphs world map network analytics dashboard chart |
||||||||||||||||||||||||||||||||||||||||
navigate by keyword : data analytics dashboard graph chart world map network computer screen technology display monitor dark blue black white lines curves points information visualization business finance global internet connection digital interface software application system control monitoring overview statistics trend analysis report theme user gui desktop background infographic |
||||||||||||||||||||||||||||||||||||||||
|
||||||||||||||||||||||||||||||||||||||||
A close-up shot of a computer screen displaying a dark blue dashboard interface. The screen shows various line graphs, data points, and a stylized world map composed of interconnected nodes. The color scheme is predominantly dark blue and black, with accents of white and light blue used for data points and labels. The graphs depict fluctuating data trends, and the world map suggests global |
||||||||||||||||||||||||||||||||||||||||
Stockphotos.ro (c) 2025. All stock photos are provided by Dreamstime and are copyrighted by their respective owners. |