computer screen showing colorful graph data analysis and statistics

navigate by keyword : data analysis statistics visualization finance investment business technology computer screen graph chart information digital analytics stock market trading trends big science infographic dashboard monitor display colorful abstract background report intelligence financial strategy exchange economic cryptocurrency blockchain fintech innovation generated

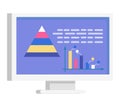
Computer screen showing colorful bar graph and pyramid chart. Business presentation with data analysis and statistics Royalty Free Stock Photo
Computer screen showing colorful graph of data analysis and statistics Royalty Free Stock Photo
Computer monitor displaying a colorful line graph with data points. Business analytics and performance metrics Royalty Free Stock Photo
Colorful glowing bar chart showing growing statistics on a computer screen Royalty Free Stock Photo
Big data analysis showing colorful circular diagrams on multiple computer screens Royalty Free Stock Photo
Colorful graphs and charts covering screen, showing data trends Royalty Free Stock Photo
Computer screen showing colorful graph of data analysis and statistics
Futuristic screen showing various colorful graphs, charts and data for trading analysis Royalty Free Stock Photo
A laptop screen showing colorful data analysis, presenting business statistics and growth charts. Royalty Free Stock Photo
Boy showing graph on monitor screen Royalty Free Stock Photo
Modern data visualization dashboard interface with bright colorful charts and graphs showing market analysis and financial Royalty Free Stock Photo
Multiple computer screens showing various colorful graphs and data analysis charts in a modern monitoring room Royalty Free Stock Photo
Data analysis dashboard on futuristic laptop screen showing colorful graphs, charts, and statistics Royalty Free Stock Photo
Close-up view laptop screen showing website traffic analytics. Colorful charts, graphs, data analysis on display. Business tech Royalty Free Stock Photo
Colorful graph showing data analysis and statistics on a computer screen, representing concepts such as finance, investment, business, and technology AI generated


Stockphotos.ro (c) 2025. All stock photos are provided by Dreamstime and are copyrighted by their respective owners.