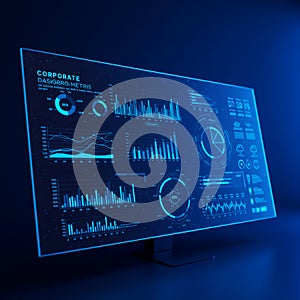
computer screen displays various data visualizations including bar graphs line |
||||||||||||||||||||||||||||||||||||||||
navigate by keyword : visualizations tracking text signage sign segments screenshot screen progress presentation poster pie performance organized number multimedia metrics line lighting light interface indicators indicating including graphs graphics gadget futuristic font displays digital design data dark corporate computer circular charts business bright brand bluetoned blue bar background analysis aigenerated advertising accentuating |
||||||||||||||||||||||||||||||||||||||||
|
||||||||||||||||||||||||||||||||||||||||
A computer screen displays various data visualizations, including bar graphs, line graphs, pie charts, and circular progress indicators. The presentation is in a futuristic blue-toned digital interface. The data is organized in segments indicating corporate metrics, potentially for business analysis or performance tracking. The background is dark, accentuating the bright blue graphics and text on the screen. |
||||||||||||||||||||||||||||||||||||||||
Stockphotos.ro (c) 2025. All stock photos are provided by Dreamstime and are copyrighted by their respective owners. |