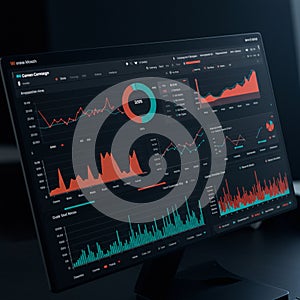
computer monitor displays various analytics dashboards graphs charts and data |
||||||||||||||||||||||||||||||||||||||||
navigate by keyword : visualizations viewing used trends tracking text teal suggests statistics signage sections screenshot red recorded realtime presentation poster pie performance organized operations numerical number multimedia monitor metrics marketing line likely layout labels interface intelligence indicate graphs generated games gadget font finance electronics easy dominate displays design data dashboards computer charts chart business brand black bar analytics analysis advertising accompanying |
||||||||||||||||||||||||||||||||||||||||
|
||||||||||||||||||||||||||||||||||||||||
Computer monitor displays various analytics dashboards. Graphs, charts, and data visualizations in red and teal indicate performance metrics. Pie charts, line graphs, and bar charts dominate the black interface, which is likely used for data analysis or business intelligence. The layout is organized into sections for easy viewing of trends and statistics, with labels and numerical data accompanying each chart. The content suggests real-time or recorded data tracking, possibly for marketing, finance, or operations. |
||||||||||||||||||||||||||||||||||||||||
Stockphotos.ro (c) 2025. All stock photos are provided by Dreamstime and are copyrighted by their respective owners. |