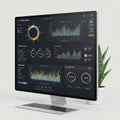
computer monitor displays data analytics dashboard with various graphs and |
||||||||||||||||||||||||||||||||||||||||
navigate by keyword : work visuals visible signage sections screenshot scheme performance percentage partially orange multimedia monitor metrics machine line layout laptop keyboard interface indicating includes gray graphs gadget font features environment electronics displays design data dashboard computer comparison color circular charts brand blue bar analytics aigenerated advertising |
||||||||||||||||||||||||||||||||||||||||
|
||||||||||||||||||||||||||||||||||||||||
A computer monitor displays a data analytics dashboard with various graphs and charts. The interface features circular and bar charts, as well as line graphs, using a color scheme of orange, blue, and gray. The layout includes sections for data comparison, performance metrics, and percentage visuals. A keyboard is partially visible, indicating a work environment. |
||||||||||||||||||||||||||||||||||||||||
Stockphotos.ro (c) 2025. All stock photos are provided by Dreamstime and are copyrighted by their respective owners. |