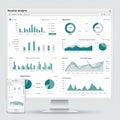
computer monitor displaying complex analytics dashboard with various graphs and

navigate by keyword : user turquoise tones text structured smartphone showcasing segmentation screenshot screen responsive providing presentation plan pie overview organized multimedia monitor mobile mirrors logo line learning layout label interface include illustrating gray graphs generated gadget font features drawing document displaying diagram devices design data dashboards dashboard computer comprehensive complex charts catering categories cartoon brand bar analytics analytic analysis advertising adjacent activity

Computer monitor displaying a complex analytics dashboard with various graphs and Royalty Free Stock Photo
A large computer monitor displaying a complex data analytics dashboard. The Royalty Free Stock Photo
Big Data Analytics Dashboard Display on Computer Screen Royalty Free Stock Photo
Laptop displaying dashboard with charts and graphs on a desk in warm lighting Royalty Free Stock Photo
Monitor displaying a dashboard with various charts and data visualizations Royalty Free Stock Photo
Futuristic Financial Data Visualization on a High-Tech Screen Displaying Complex Stock Market Charts and Graphs Royalty Free Stock Photo
Advanced Data Analysis Display Showing Multiple Charts and Graphs Royalty Free Stock Photo
Computer monitor displaying a complex analytics dashboard with various graphs and
A detailed closeup of a computer screen displaying complex data and code Royalty Free Stock Photo
Widescreen Monitor Displaying Complex Data Interface with Cool Blue Tones Royalty Free Stock Photo
Computer Screen Displaying Large Amount of Data Royalty Free Stock Photo
Laptop displaying complex data visualizations and charts on a dark background Royalty Free Stock Photo
AI-Generated Data Visualization Royalty Free Stock Photo
A computer screen with a bunch of graphs on it Royalty Free Stock Photo
Computer monitor displaying a complex analytics dashboard with various graphs and charts. The interface features bar graphs, pie charts, and line graphs, illustrating data in turquoise and gray tones. Categories include segmentation and user activity. An adjacent smartphone screen mirrors similar analytic data, showcasing the dashboard's responsive design for mobile devices. The layout is structured and organized, catering to data analysis needs and providing a comprehensive overview.


Stockphotos.ro (c) 2025. All stock photos are provided by Dreamstime and are copyrighted by their respective owners.