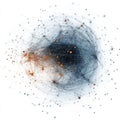
complex network data visualization with interconnected nodes and lines |
||||||||||||||||||||||||||||||||||||||||
navigate by keyword : network data visualization interconnected nodes complex lines communication digital information connection structure technology abstract web analysis patterns design connectivity geometry system flow blue orange dynamic mapping interconnection plotting science interaction representation networked datadriven clusters community flowchart pattern algorithm diagram generated |
||||||||||||||||||||||||||||||||||||||||
|
||||||||||||||||||||||||||||||||||||||||
A visualization portraying a complex network of interconnected nodes with blue and orange spheres. lines illustrate the intricate connections between various points, creating a dynamic pattern representing data flow and communication. AI generated |
||||||||||||||||||||||||||||||||||||||||
Stockphotos.ro (c) 2025. All stock photos are provided by Dreamstime and are copyrighted by their respective owners. |