complex interface displays multiple financial graphs and charts featuring line

navigate by keyword : values triangular trading tracking text signage set screenshot representation relate red realtime presentation present poster panels oscillators orange numerical numeric numbers number multiple multimedia metrics markets logo lines line layout labels interface indicators includes icon graphs graph games gadget font financial featuring elements document displays diagram design decorative data dark complex circle charts central brand bottom blue bar background

A complex interface displays multiple financial graphs and charts, featuring line and Royalty Free Stock Photo
Digital screen displays complex financial data, featuring multiple graphs and charts. Royalty Free Stock Photo
Futuristic digital interface featuring multiple financial charts on a dark background. Royalty Free Stock Photo


A complex interface displays multiple financial graphs and charts, featuring line and


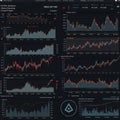
A complex interface displays multiple financial graphs and charts, featuring line and bar graphs, oscillators, and numeric data across several panels. The layout is set against a dark background, with red, orange, and blue lines for data representation. The text includes various labels and numbers that appear to relate to financial markets or trading data. Central graph indicators and numerical values suggest real-time tracking of financial metrics. A triangular icon is present at the bottom with decorative elements.


Stockphotos.ro (c) 2025. All stock photos are provided by Dreamstime and are copyrighted by their respective owners.