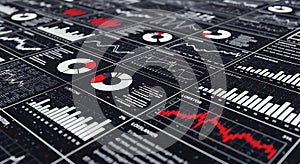
complex digital dashboard displaying various financial data visualizations charts and graphs modern sleek interface

navigate by keyword : white visualizations visualization usage trends trading tools techniques sug specific software sleek shows showcases serious science scheme representation reporting red presentation practices points pie performance office offering occasional numerous monitoring modern mining metrics market management line layout kpis key investment interpretation interface intelligence inspiration insights information info indicators including highlight gridlike graphs graphics graph future financial finance filled features exploration examples displaying

Dark-themed digital financial dashboard displaying various data visualizations. Royalty Free Stock Photo
a complex digital dashboard displaying various financial data visualizations, charts, and graphs in a modern and sleek interface d Royalty Free Stock Photo
Modern Business Intelligence Data Analytics Dashboard Royalty Free Stock Photo
Modern Computer Monitor Displaying Financial Data and World Map Royalty Free Stock Photo
Laptop displaying complex data visualizations and charts on a dark background Royalty Free Stock Photo
   
   
a complex digital dashboard displaying various financial data visualizations, charts, and graphs in a modern and sleek interface d
Modern laptop displaying complex data analytics and financial charts on a dark interface Royalty Free Stock Photo
Futuristic Transparent Data Analytics Dashboard Royalty Free Stock Photo
AI-Generated Data Visualization Royalty Free Stock Photo
High-Tech Data Analytics Workstation in a Futuristic Control Room Royalty Free Stock Photo
Abstract Digital Data Visualization Dashboard Royalty Free Stock Photo
Futuristic Digital Data Analytics Interfaces Royalty Free Stock Photo
Tablet displaying complex data visualizations and charts on a dark interface Royalty Free Stock Photo
the image showcases a digital dashboard filled with various financial data visualizations. the dashboard features a grid-like layout with numerous charts and graphs, including line graphs, bar charts, and pie charts. the color scheme is predominantly black and white, with occasional accents of red to highlight specific data points or trends. the overall aesthetic is modern and sleek, sug


Stockphotos.ro (c) 2025. All stock photos are provided by Dreamstime and are copyrighted by their respective owners.