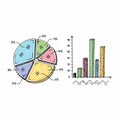
colorful pie chart and bar graph data visualization for business reports presentations |
||||||||||||||||||||||||||||||||||||||||
navigate by keyword : pie chart bar graph data visualization business report presentation colorful infographic statistics analysis marketing finance financial analytics information diagram representation visual tools charts template |
||||||||||||||||||||||||||||||||||||||||
|
||||||||||||||||||||||||||||||||||||||||
Colorful 3D Pie Chart and Bar Graph Data Visualization for Business Reports and Presentations. Generative AI |
||||||||||||||||||||||||||||||||||||||||
Stockphotos.ro (c) 2025. All stock photos are provided by Dreamstime and are copyrighted by their respective owners. |